STEem Debug - The Boiler Room
v1.05
A tiny guide by Excellence in Art, written to (hopefully) help people who are confounded by STEem’s eeeeeeexcellent debugger.

Important
-
You need to run a debug build of STEem to use the debugger.
-
When writing this document, I have been using STEem SSE v3.7.2 - most of the information here should cover every version/hack of STEem, but I can’t really guarantee anything.
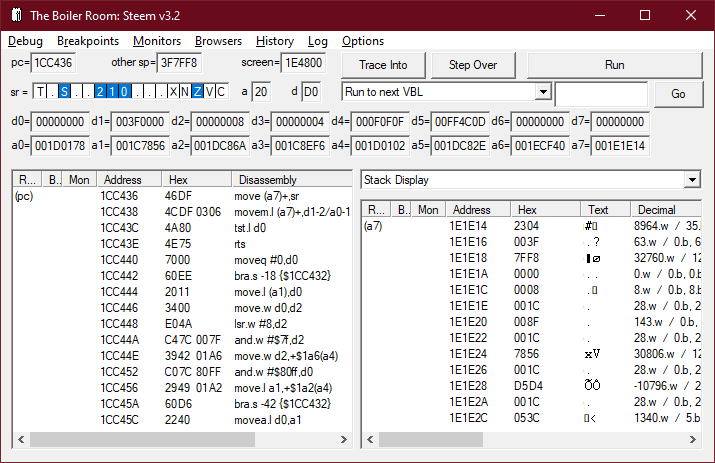
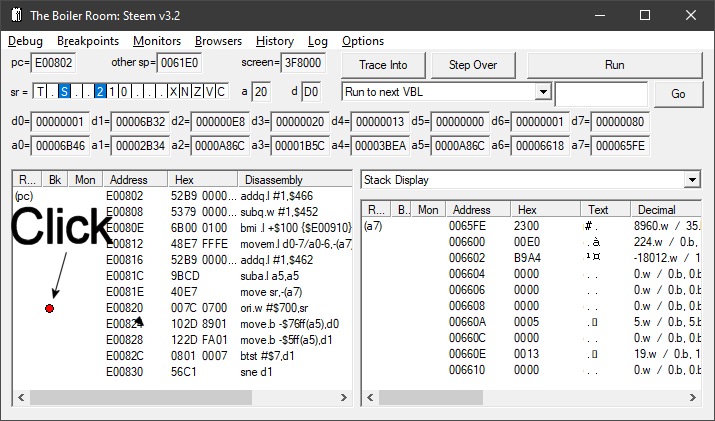
The three buttons at the top right of the Boiler Room window
[ Trace into ] Runs the current instruction (the one that Program Counter is pointing at), and then pauses, returning control to you.
[ Step Over ] If the instruction about to execute is a JSR or BSR, STEem executes the subroutine, but doesn’t trace it, instead it returns control to you upon returning from the subroutine.
[ Run/Stop ] Starts/stops the virtual machine.

How do I…?
Add keyboard shortcuts for debug commands?
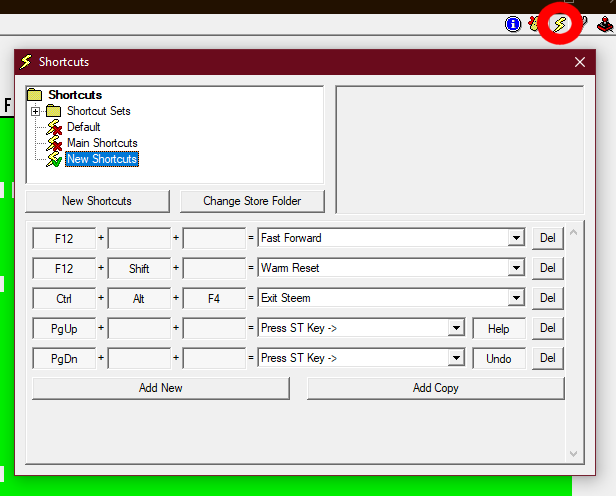
Under the Shortcuts menu in the STEem window (not the Boiler Room window!). The icon is a little yellow bolt of lightning. I recommend you set easy-to-reach keyboard shortcuts for:
- Toggle Emulation Start/Stop
- Trace Into
And relatively easy-to-reach keyboard shortcuts for:
- Run to RTS
- Run to RTE
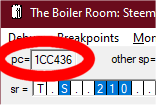
Find out where in memory the virtual machine’s Program Counter (PC) is?
It’s in the top-left corner of the Boiler Room window.
Break my program from within my code?
Write a byte value (any value) to address $ffffc123.
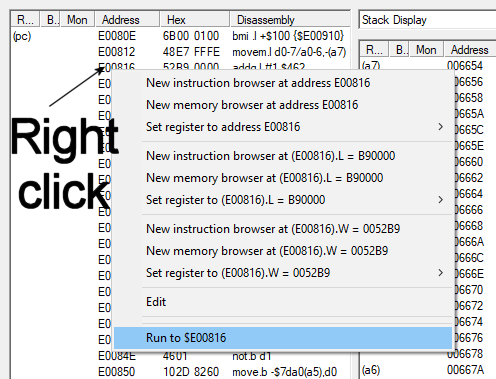
Break my program when the instruction at a specific address is executed?
There are two methods.
- You can right-click anywhere on the line of the address in question (either in a browser window or the Boiler Room window itself) and choose “Run to [$address]”.
- Scroll to the address where you want the break to occur (either in a browser window or the Boiler Room window itself) and click the “Bk” column for that row (note: at the default Window size on modern Windows versions, this column will initally only be shown as “B”). Now every time the virtual machine hits this address, it will halt execution for you.
Break my program when a specific address is modified?
In all browser windows, there’s a “Mon” column directly to the left of the “Address” column. Clicking in the Mon column for a row toggles between three states: blank (nothing), Write (a block of red lines with an arrow pointing at the lines) and Read (a block of red lines with an arrow pointing away from the lines). As an extra clue, in the “Hex” column, the word value in question gets marked red for Write breakpoints and blue for Read breakpoints.
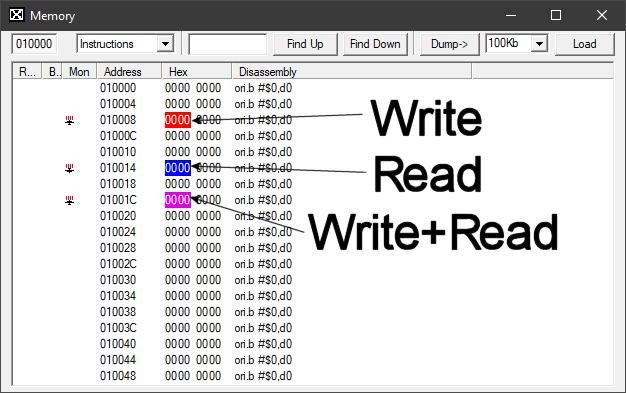
Break my program when a specific address is read from?
In all browser windows, there’s a “Mon” column directly to the left of the “Address” column. Clicking in the Mon column for a row toggles between three states: blank (nothing), Write (a block of red lines with an arrow pointing at the lines) and Read (a block of red lines with an arrow pointing away from the lines). As an extra clue, in the “Hex” column, the word value in question gets marked red for Write breakpoints and blue for Read breakpoints.
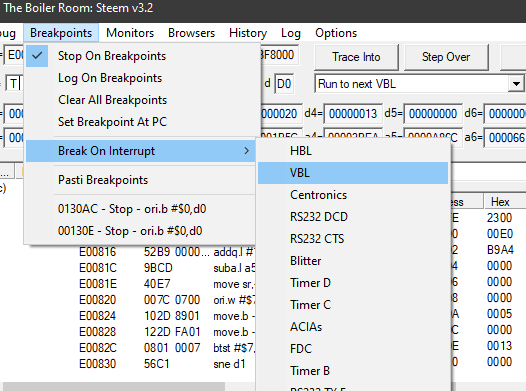
Break my program when a specific interrupt is triggered?
Breakpoints | Break On Interrupt | [pick interrupt]
Make STEem Debug break automatically when I run a program?
Options | Stop on next program run
Make the virtual machine run until the next VBL occurs?
Directly below the “Trace Into” button at the top of the Boiler Room window is a dropdown box with the values “Run to next VBL”, “Run to scanline n”, “Run for n cycles” and “Run until instruction changes”. To halt the virtual machine at the next VBL, select “Run to next VBL” and click the “Go” button to the right of the box to execute.
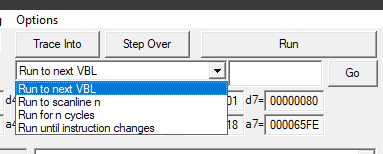
Make the virtual machine run until the raster hits a specific scanline?
Directly below the “Trace Into” button at the top of the Boiler Room window is a dropdown box with the values “Run to next VBL”, “Run to scanline n”, “Run for n cycles” and “Run until instruction changes”. To halt the virtual machine when its raster beam hits a specific scanline, enter the scanline’s number in the edit box directly to the right of the dropdown box, select “Run to scanline n” from the dropdown box itself and click the “Go” button to the right to execute.
Make the virtual machine run for a specific number of clock cycles and halt?
Directly below the “Trace Into” button at the top of the Boiler Room window is a dropdown box with the values “Run to next VBL”, “Run to scanline n”, “Run for n cycles” and “Run until instruction changes”. To run the virtual machine for a specific number of clock cycles, when its raster beam hits a specific scanline, enter the number of cycles in the edit box directly to the right of the dropdown box, select “Run for n cycles " from the dropdown box itself and click the “Go” button to the right to execute.
Remove a breakpoint?
If it’s a “normal” breakpoint (i e one that triggers on the virtual machine’s Program Counter reaching a specific address, or a read/write) from a specific address), find the address in question in browser window and click it to toggle it until it disappears.
Another option is to go to the Breakpoints menu, which lists all “normal” breakpoints at the bottom, and click the one you want to change - this opens up a browser window at that breakpoint’s address, and you can toggle it there by clicking it.
Clear all breakpoints at once, so the virtual machine doesn’t halt all the time?
Breakpoints | Clear All Breakpoints
Tell STEem Debug to run until it hits an RTS (return from subroutine)?
Debug | Run To RTS
Tell STEem Debug to run until it hits an RTE (return from exception/interrupt)?
Debug | Run To RTE
Save a piece of RAM to disk as a binary file?
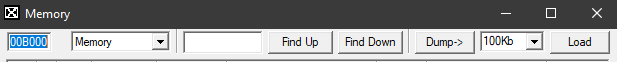
From a Memory Browser window, directly to the right of the “Load” button in the top right corner, there’s a dropdown box that lets you choose how large an area you want to save (you can type directly into the box too!). Once you’re happy with the value in the box, click the “Dump->” button and choose a filename and location thru the file selector.
Save a piece of RAM to disk as disassembly?
From an Instruction Browser window, directly to the right of the “Load” button in the top right corner, there’s a dropdown box that lets you choose how large an area you want to save (you can type directly into the box too!). Once you’re happy with the value in the box, click the “Dump->” button and choose a filename and location thru the file selector.
Find out the values of the Condition Code flags?
In the top left corner of the Boiler Room windows is the Program Counter (PC) box. Directly below it is the Status Register (SR) box and 16 squares saying “T.S..210…XNZVC”. The five rightmost are the flags: eXtend, Negative, Zero, oVerflow and Zero respectively. Blue background means a bit is set (1); white background means it’s clear (0).
Change the Condition Code flags?
The easiest way in most situations is to simply click the flag you want to change to toggle it. If you feel more comfortable working in hex (and who doesn’t these days?), you can right-click the SR box and choose “Edit” in the menu that appears.
View memory as text without hex values?
Browsers | New Text Browser
Find out the last instructions the virtual machine executed?
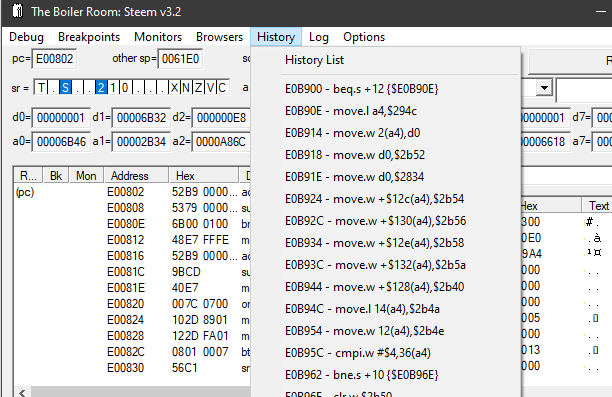
History menu - The menu itself shows the latest instructions, with the latest one at the bottom. For a more complete list, the History List option in the History menu is what you want.
Make STEem Debug show all my monitor windows on the Windows Taskbar?
Browsers | Put Browsers On Taskbar
Browse what’s at the address pointed to by a register?
Near the top of the Boiler Room window are two lines showing all the internal registers of the 68000; D0-D7 and the User Stack Pointer (USP) on the first row, A0-A7 and the Supervisor Stack Pointer (SSP) on the second. Right-clicking on a register or its value brings up a menu where you can choose to open a new Instruction Browser or Memory Browser at the address.
Edit a register?
Near the top of the Boiler Room window are two lines showing all the internal registers of the 68000; D0-D7 and the User Stack Pointer (USP) on the first row, A0-A7 and the Supervisor Stack Pointer (SSP) on the second. You can simply click a register’s value to edit it.
Edit a memory location?
You can simply click the value in the Hex column anywhere in a browser window (or the Boiler Room window itself) to edit it.
Make the virtual machine run until the Program Counter (PC) reaches a specific address?
You can either place a regular breakpoint at the address in question (See Break my program when the instruction at a specific address is executed?, or you can simply right-click anywhere on the line of the address in question (both in a browser window and the Boiler Room window itself) and choose “Run to [$address]”.
Other questions
What’s the difference between a breakpoint and choosing “Run to [$address]”?
Good question! Right-clicking on a line of code or data and choosing “Run to [$address]” will perform the task only once. Placing a breakpoint will cause the virtual machine to halt every time that breakpoint is reached.
Activate logging? How do I use logging? Why logging? Do I want it?
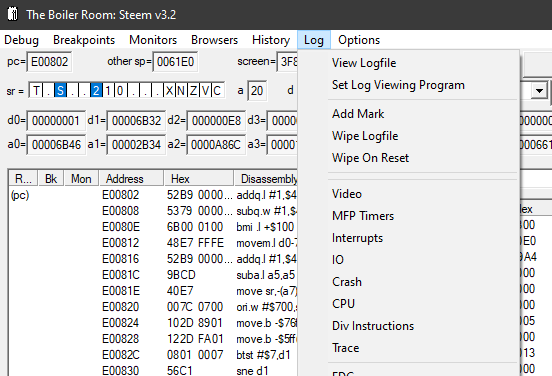
Logging can be an amazing tool for situations where stepping thru the code takes too much time/effort, but you still need to keep track of certain events.
Ok, I want logging. How do I see what’s in the log?
Log | View Logfile
How do I clear the logfile?
Log | Wipe Logfile/TRACE
How do I make the log tell me when a breakpoint in my code is hit?
There’s something really fishy going on in STEem - it seems it will always do that if stopping on breakpoints is enabled. The setting Breakpoints | Log On Breakpoints doesn’t seem to do anything at ALL. Enabling Breakpoints | Stop On Breakpoints enables logging of breakpoints too. Oh well.
Can I log memory reads/writes too?
Monitors | Log On Activation
It would be nice if I could place a mark in the log file to let me know that “here this-or-that started”
Sure! Log | Add Mark
It would be even nicer if I could do that from within my code…
Agreed. And that’s not a problem! Just write a longword pointer to a null-terminated string to address $ffffc1f0. …perhaps a code snippet explains it better:
  move.l #debugtext,$ffffc1f0
  rts
debugtext:
  dc.b "Hello. This is your code writing to the logfile!",0
  even
Fun facts
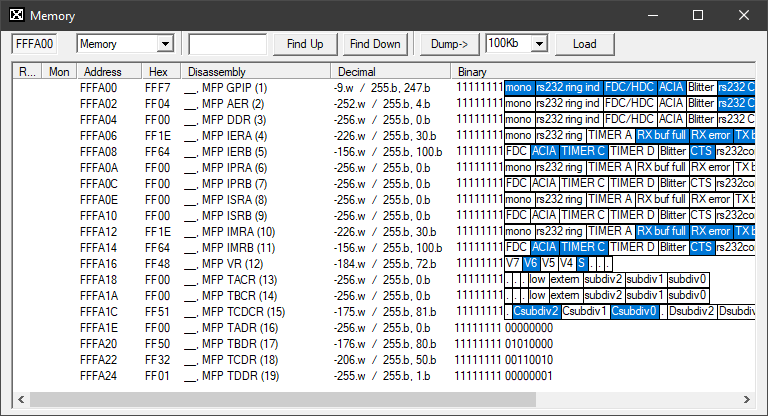
- Specific memory areas display specially and some even let you edit bits by clicking (like MFP).
-
This document was written on a keyboard missing both the “K” key and “,” keys.
-
Right-click in breakpoint column to name an address.
-
Right-clicking a named breakpoint shows name in top of menu.